The reports presented in this section have two purposes. The follow-up reports show recommended services, based on checklist recommendations and shop codes. The marketing reports provide statistics about the customers and their vehicles.
Please watch the following video to see an overview of the Marketing reports.
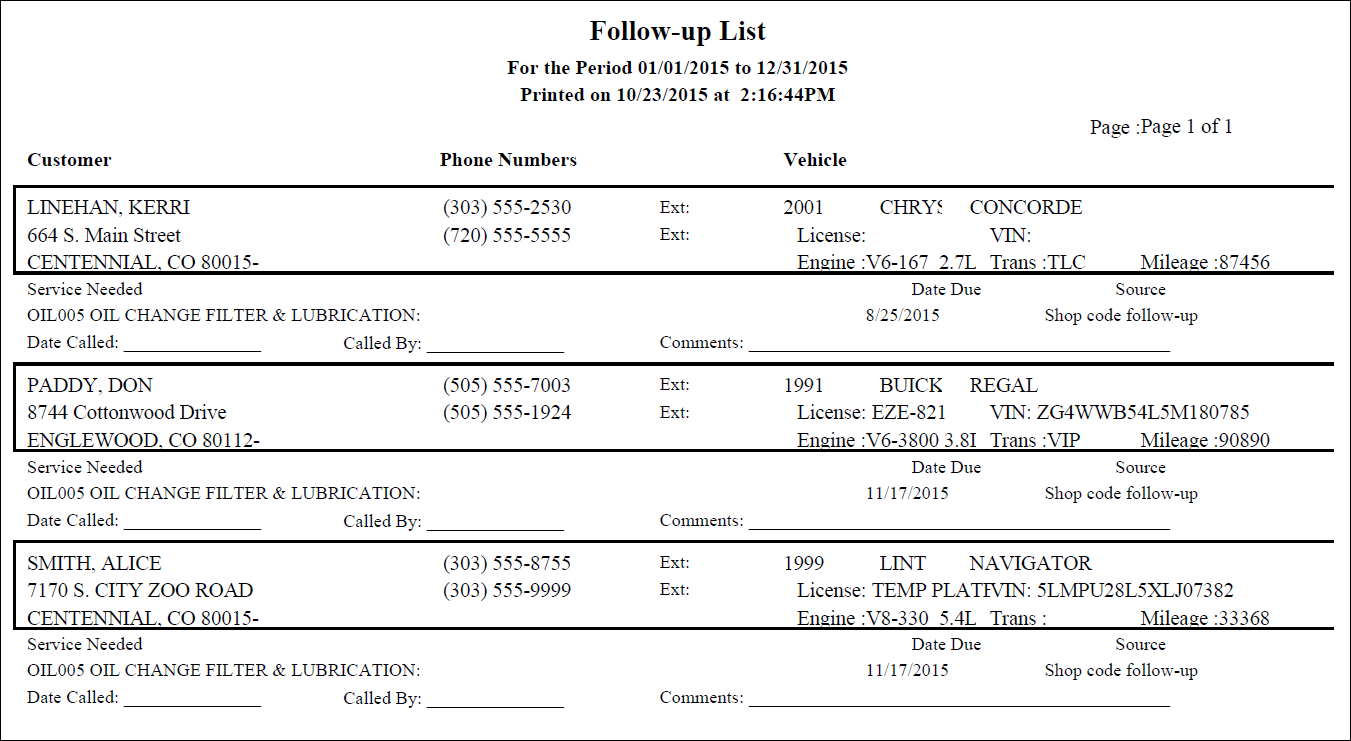
Follow-up Lists
There are two follow-up lists: the first is for non-fleet customers, the second is for fleet customers.
These two reports require a date range and contain the following information:
- Customer Information (Name, Address, Telephone Numbers)
- Vehicle Information (Year, Make, Model, Engine, Transmission, License Number, VIN, and Mileage)
- Service Needed Date Due
- Source (Repair Order Checklist, or Shop Code Follow-up)
Follow-up List - Regular
Marketing Reports
Marketing Reports provide statistics about various aspects of customers and their vehicles. You can use these reports to analyze where customers are coming from, the types of vehicles that they have, and how much they are spending.
This information can help you
- Target your marketing campaigns.
- Evaluate inventory stock and levels.
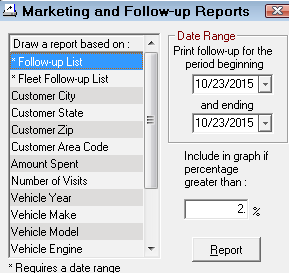
Selection Criteria
These marketing reports do not use a date range. Instead, each report contains the selection criteria, the count or number of customers or vehicles of each type of the selection criteria, and the percent of the total number.
The following selection criteria are available:
- Customer City
- Customer State
- Customer Zip Code
- Customer Area Code
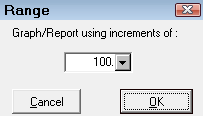
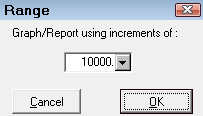
- Amount Spent - You must enter an increment number on the Range popup window.
- Number of Visits
- Vehicle Year
- Vehicle Make
- Vehicle Model
- Vehicle Engine
- Vehicle Transmission
- Vehicle Mileage - The Vehicle Mileage Report requires you to enter an increment number on the Range popup window.
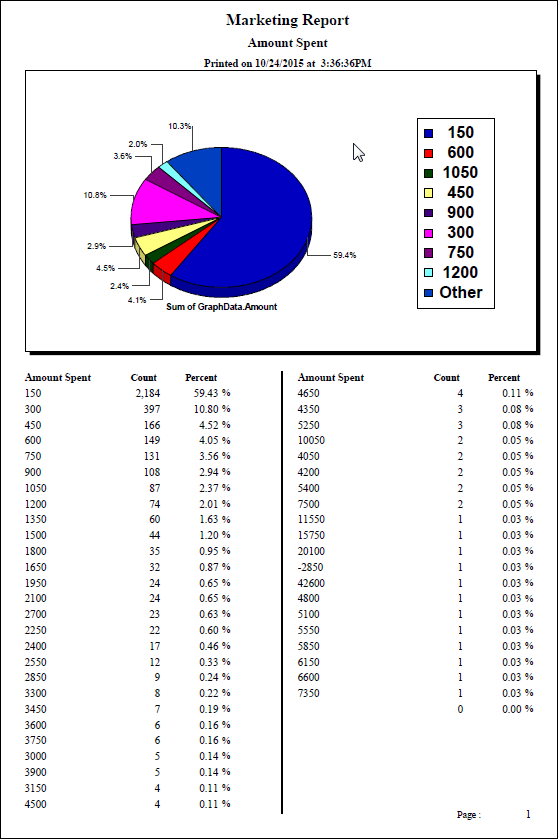
Amount Spent Report
An example of the report by amount spent.
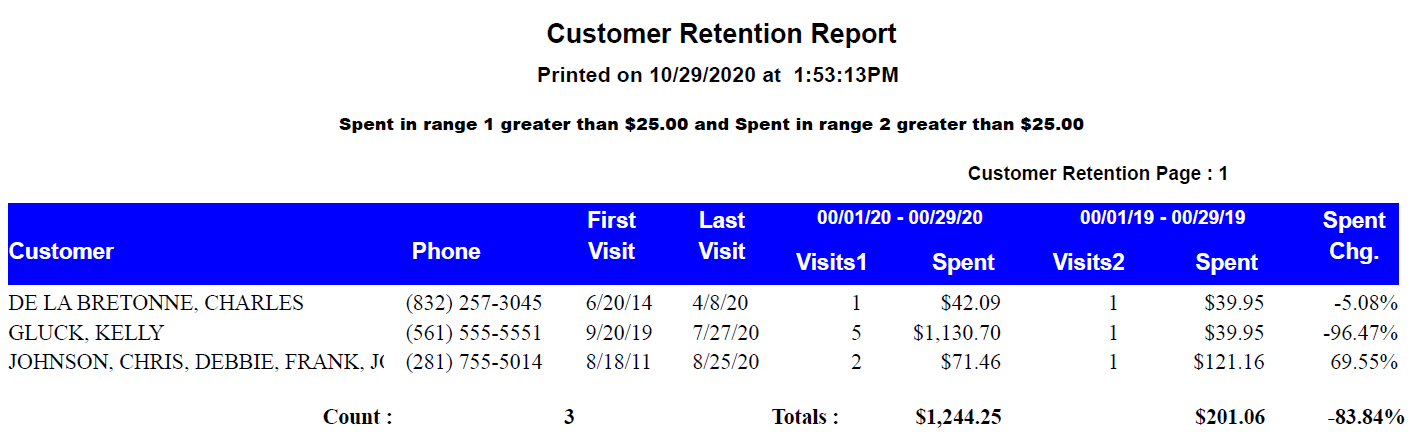
Customer Retention Report
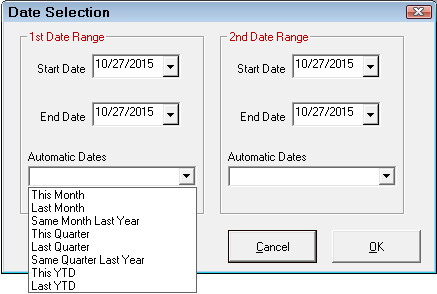
The Customer Retention report includes data to help you gauge your repeat customers.
You need to
- Select a date range and click OK to run the report.
- Select the filters such as
- Customers who have spent more than $25.00.
- Last visit date range.
- Select the customer sequence (ascending or descending order).
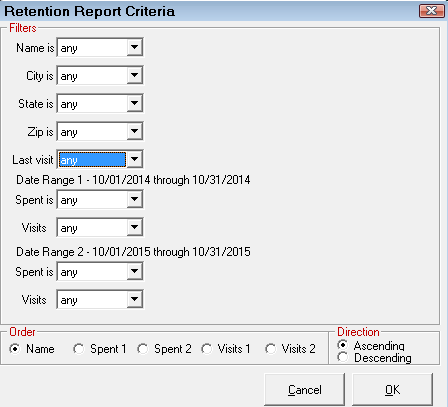
- Click OK to generate the report.
The customer's name, phone number, first visit, and last visit is listed. The number of visits and the amount spent for each date range and the percentage of the amount spent that was different between the two date ranges is shown.