Management Analyzer
This tool provides a means to utilize the past performance of the shop to analyze and make judgments about future performance goals.
Selection criteria include the beginning and ending date of shop information to include in the analysis, the profit center to include, and which service writer to analyze.
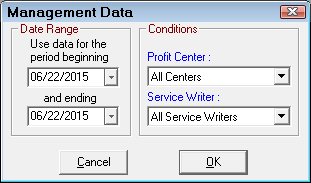
For the whole organization to be included in the analysis, all centers and all service writers may be selected.
NOTE: You cannot print or export Management Analyzer results.
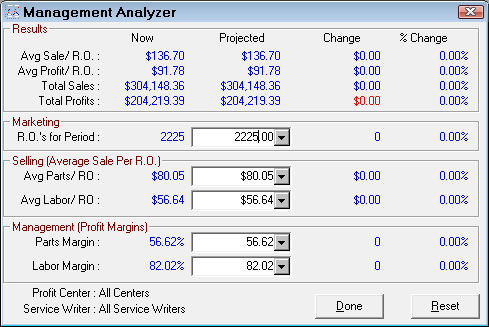
Results
The results of the search criteria are shown in the top box. Criteria for projections include marketing, sales per repair order, and management effectiveness that affect profit margins. Analysis may be done for each section to see the individual effect, or combined, as in the illustration, to see the overall effect of several changes. The results of the changes are shown in the projected column, with the revenue change and percent change also listed.
Marketing
The marketing portion provides projections based on a change in the number of vehicles serviced by the shop. Perhaps the shop goal is to increase the number of vehicles serviced. The marketing and follow-up module may help with increasing the number of customers returning to the shop. Advertising may help increase volume. If the goal is to decrease the volume, perhaps to change the hours of operation, this can show the projected loss of revenue, based on decreased volume.
In the analysis shown, an increase of eleven vehicles would increase the revenues by 6.71% for the time frame selected. If the time frame selected were a month, for instance, increasing the number of customers by eleven would increase total sales by 6.71% for the month.
Selling
The selling portion provides revenue estimated based on average sales per repair order for the period selected. The sales are broken down into parts and labor. This portion of the analysis will calculate the effect of increasing average parts and labor sales per repair order, perhaps by doing inspections and recommending services.
In the analysis shown, an increase in average parts sales per repair order by $21.57 would result in an overall increase in revenues of 6.57% for the time frame selected. If the time frame selected were a month, for instance, increasing the parts sales per repair order by $21.57 would increase parts sales by 6.71% for the month.
Likewise for the labor, an increase in average labor sales per repair order by $29.31 would result in an overall increase in revenues of 24.28% for the time frame selected. If the time frame selected were a month, for instance, increasing the parts sales per repair order by $29.31 would increase labor sales by 24.28% for the month.
Management
Management effectiveness deals with pricing policies for parts and labor. This is a sensitive area for both the shop management and the customers. The shop must make a sufficient margin on parts and labor to cover expenses, and make a profit, but yet the prices must remain competitive with other shops in the area to keep customers. While price is important, customers are also looking for a shop that is convenient, courteous, and that fixes their car correctly and when promised. Customers may be willing to pay a premium for these intangibles. Pricing policies, purchasing practices, pay incentive programs, and general employee relations are all factors that may affect management effectiveness.
In the analysis shown, an increase in the parts gross margin of 3.68% to 52% results in an overall revenue increase of 7.61%. The increase may be the results of better parts management in the shop, better pricing from the supplier, or maybe just an increase in the sales price.
Likewise for labor, an increase in the labor gross margin of 0.98% to 60% results in an overall revenue increase of 1.67%. This increase could be the result of better planning resulting in less idle time for the technicians, better estimating for billable labor hours, or just an increase in the labor rate.
The overall results of all of the efforts may be seen. By making small changes in the profit margin (Management Effectiveness), increasing sales of services, and by the marketing efforts to increase the number of cars serviced, the average sale increased 11.33% while the average profit increased 18.29%. The profit made on each repair order increased at a higher rate than sales, meaning that the shop just did not sell more of the same. Improvements were made which increased profitability. This is also reflected in the increase in total sales vs. total profits. While sales increased 18.80%, profits increased 26.23%, indicating that operational efficiencies were gained which increased profitability.