The same information that was presented in tabular form in the reports can be shown as graphs.
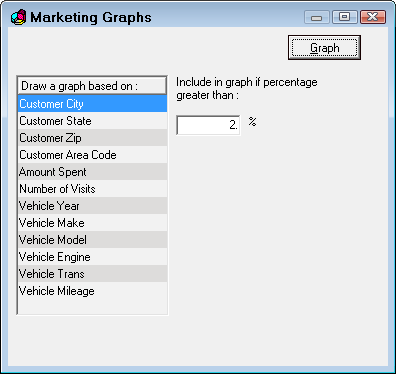
Click the Graph button to see the Marketing report information in a bar graph format.
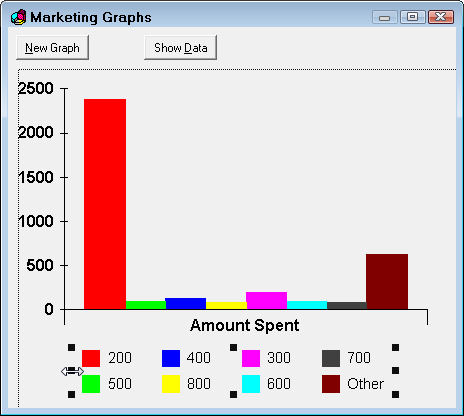
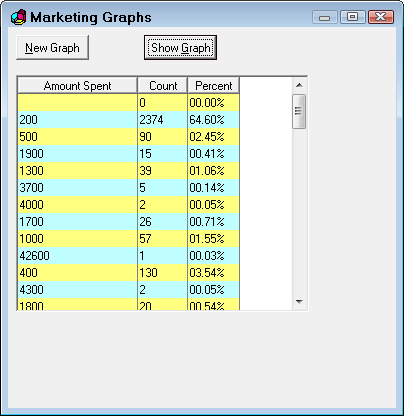
Click the Show Data button to see the data in a graph in a table format.
Editing Marketing Graphs
Clicking on an object in the graph to select that object. The sizing handles appear. You can moved or re-size the object with the mouse.
Double-click on an object to activate its editing functions.
Marketing Graph Options
Right-click to see additional editing options on a popup menu. You can change, save or print your graphs.
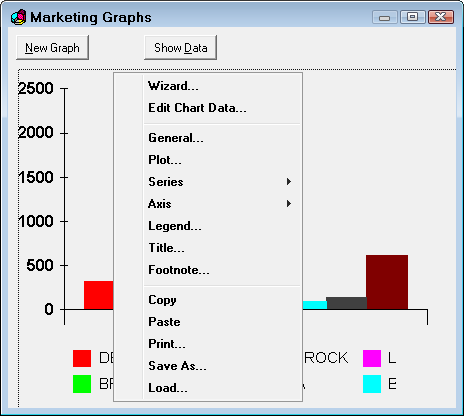
The right-click menu items are listed below. Some items open windows when selected.
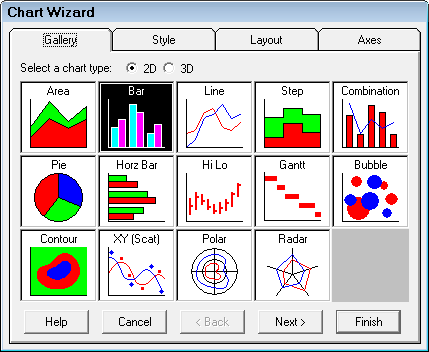
Wizard
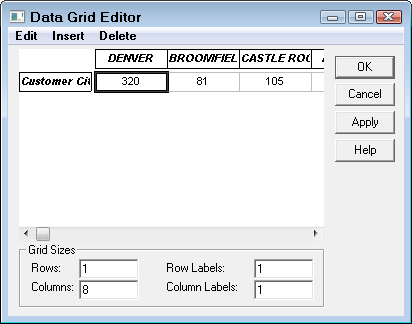
Edit Chart Data
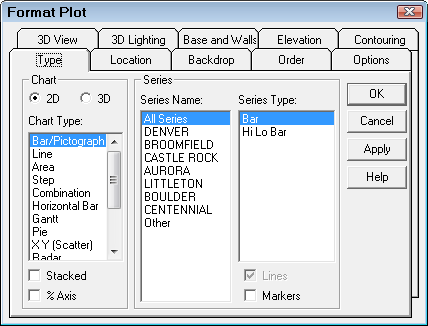
General
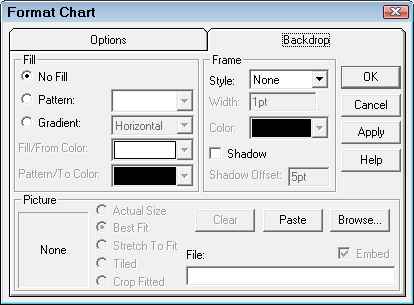
Plot