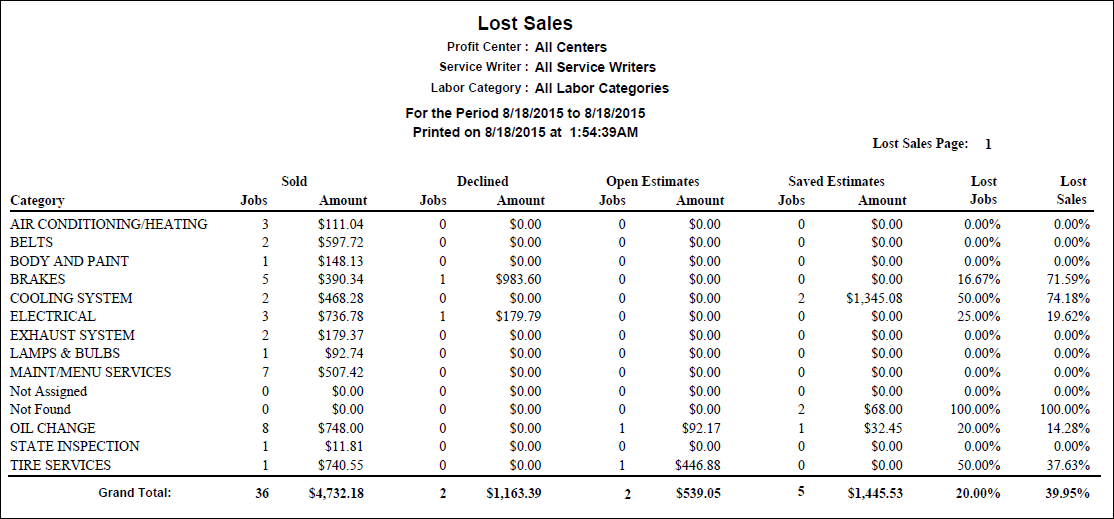
The Lost Sales by Category report shows all sales lost within a date range you enter.
Lost Sales by Category Report Data
The data on this report appears in rows and column groups.
Lost Sales by Category Report Rows
Each row is a labor category.
- The Not Found row is for labor operations with no category.
- The Not Assigned Row includes
- Labor and parts with no technician assigned.
- Parts not attached to labor operations in job-based view.
NOTE: When Count Jobs by Category is checked in the report criteria, the totals do not reflect the number of labor operations. If there are two labor operations for the same category, they are counted as one.
Sold Column Group
| Column | Description |
|---|---|
| Jobs | Number of labor operations sold. |
| Amount | Total sales. |
Declined Column Group
| Column | Description |
|---|---|
| Jobs | Number of labor operations declined. |
| Amount | Total sales that were declined. |
Open Estimates Column Group
| Column | Description |
|---|---|
| Jobs | Number of labor operations on open estimates. |
| Amount | Total sales amount on open estimates. |
Saved Estimates Columns
| Column | Description |
|---|---|
| Jobs | Number of labor operations on saved estimates. |
| Amount | Total sales amount on saved estimates. |
Lost Jobs Column
The percentage of all jobs that were declined.
Lost Sales Column
The percentage of all sales that were declined.
NOTE: Discounts are not subtracted from the above totals.
Drilldown Reports
When printed to the screen, the Lost Sales by Category report is a drilldown report. On this report, it means you can select a specific category and technician to open a report for that category.
Double-click on a category tab to open the same report for that specific category by technician in a new tab.
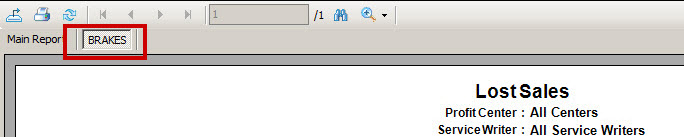
The tabbed report shows only the selected category.
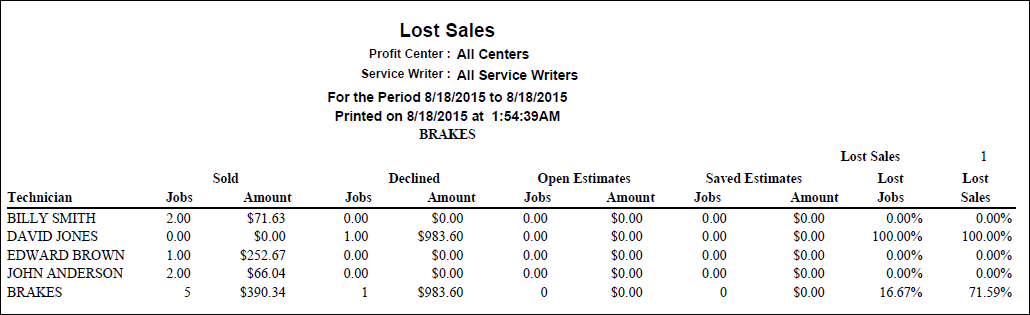
Double-click on a technician to view the report for that specific technician by repair order and job.
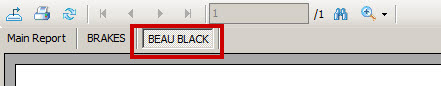
The report shows sales by the selected category and technician.
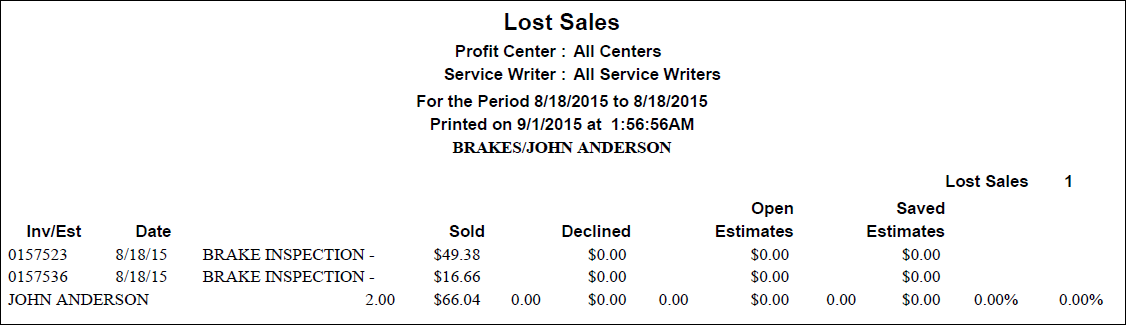
The detail screen for specific technicians shows the following information for each repair order or estimate.
Lost Sales Report Columns
| Column | Definition |
|---|---|
| Inv/Est | Repair order or estimate number |
| Date | Closed or saved date |
| Sold | Total sales amount sold |
| Declined | Total sales amount declined |
| Open Estimates | Total sales amount on open estimates |
| Saved Estimates | Total sales amount on saved estimates |
| Lost Jobs | Percentage of all jobs that were declined |
| Lost Sales | Percentage of all sales that were declined |