The Sales by Category Comparison report compares sales and profits between two date ranges such as a comparison from last year to this year.
When the Print button is selected, the Date Selection window opens where you select two date ranges for comparison.
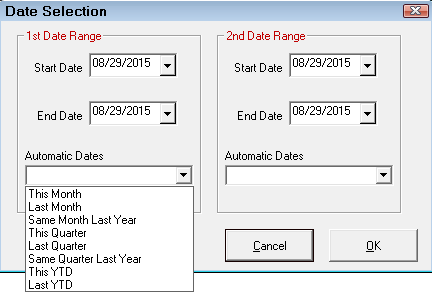
You can use the Start Date and End Date fields or the Automatic Dates dropdown list.
Report Sample
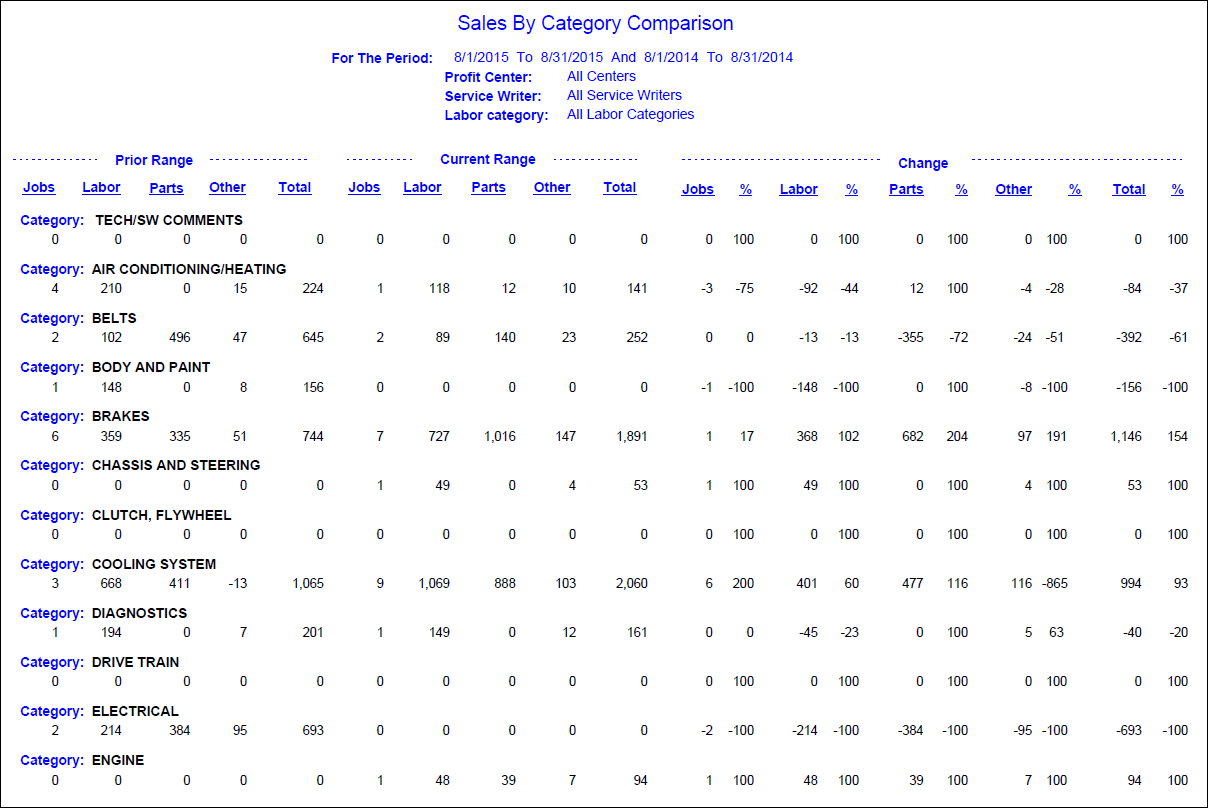
Column Sections
Each category is grouped into two date ranges and then the difference between them.
Prior Range Columns
| Column | Definition |
|---|---|
| Labor |
Total labor sales. "Not Found" is for labor with no labor category was assigned. “Not Assigned” is for labor with no technician assigned. |
| Parts |
Total parts sales for parts attached to labor operations in job-based view. “Not Assigned” is for
|
| Other | Sales Tax plus Non Taxable Parts Fees plus Supply charges minus Discounts. Sales taxes and supply charges are averaged across categories for each repair order. |
| Total | Labor + Parts + Other. |
Current Range Columns
| Column | Definition |
|---|---|
| Jobs | Number of jobs. |
| Labor | Total labor sales. Labor with no category assigned will show under the category Not Found. Labor with no technician assigned will show the technician as Not Assigned. |
| Parts | Total parts sales for parts attached to labor operations in job-based view. Parts not attached to labor operations will show under the category Not Assigned. Parts with no technician assigned will show the technician as Not Assigned. |
| Other | Sales Tax plus Non Taxable Parts Fees plus Supply charges minus Discounts. Sales Taxes and Supply charges are averaged across categories for each repair order. |
| Total | Labor + Parts + Other. |
Change Columns
| Column | Definition |
|---|---|
| Jobs | The difference in the number of jobs |
| % | The percentage difference |
| Labor | The difference in the number of labor sales |
| % | The percentage difference |
| Parts | The difference in the amount of parts sales |
| $ | The percentage difference |
| Other | The difference in the amount of the other column |
| % | The percentage difference |
| Total | The difference in the total |
| % | The percentage difference |
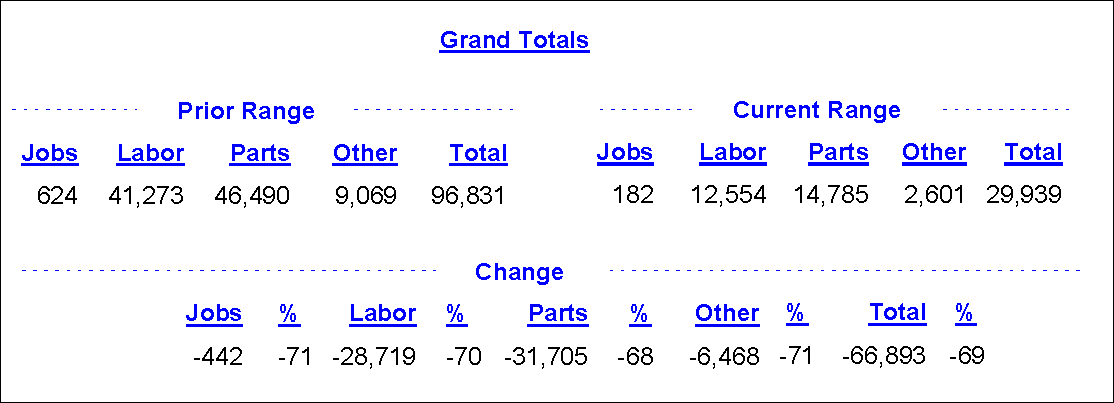
Grands Totals
The grand totals at the end of the Sales by Category Comparison report.
Drilldown Report
When printed to the screen, this is a drilldown report. You can double-click on any category to open another tab that displays only that row.