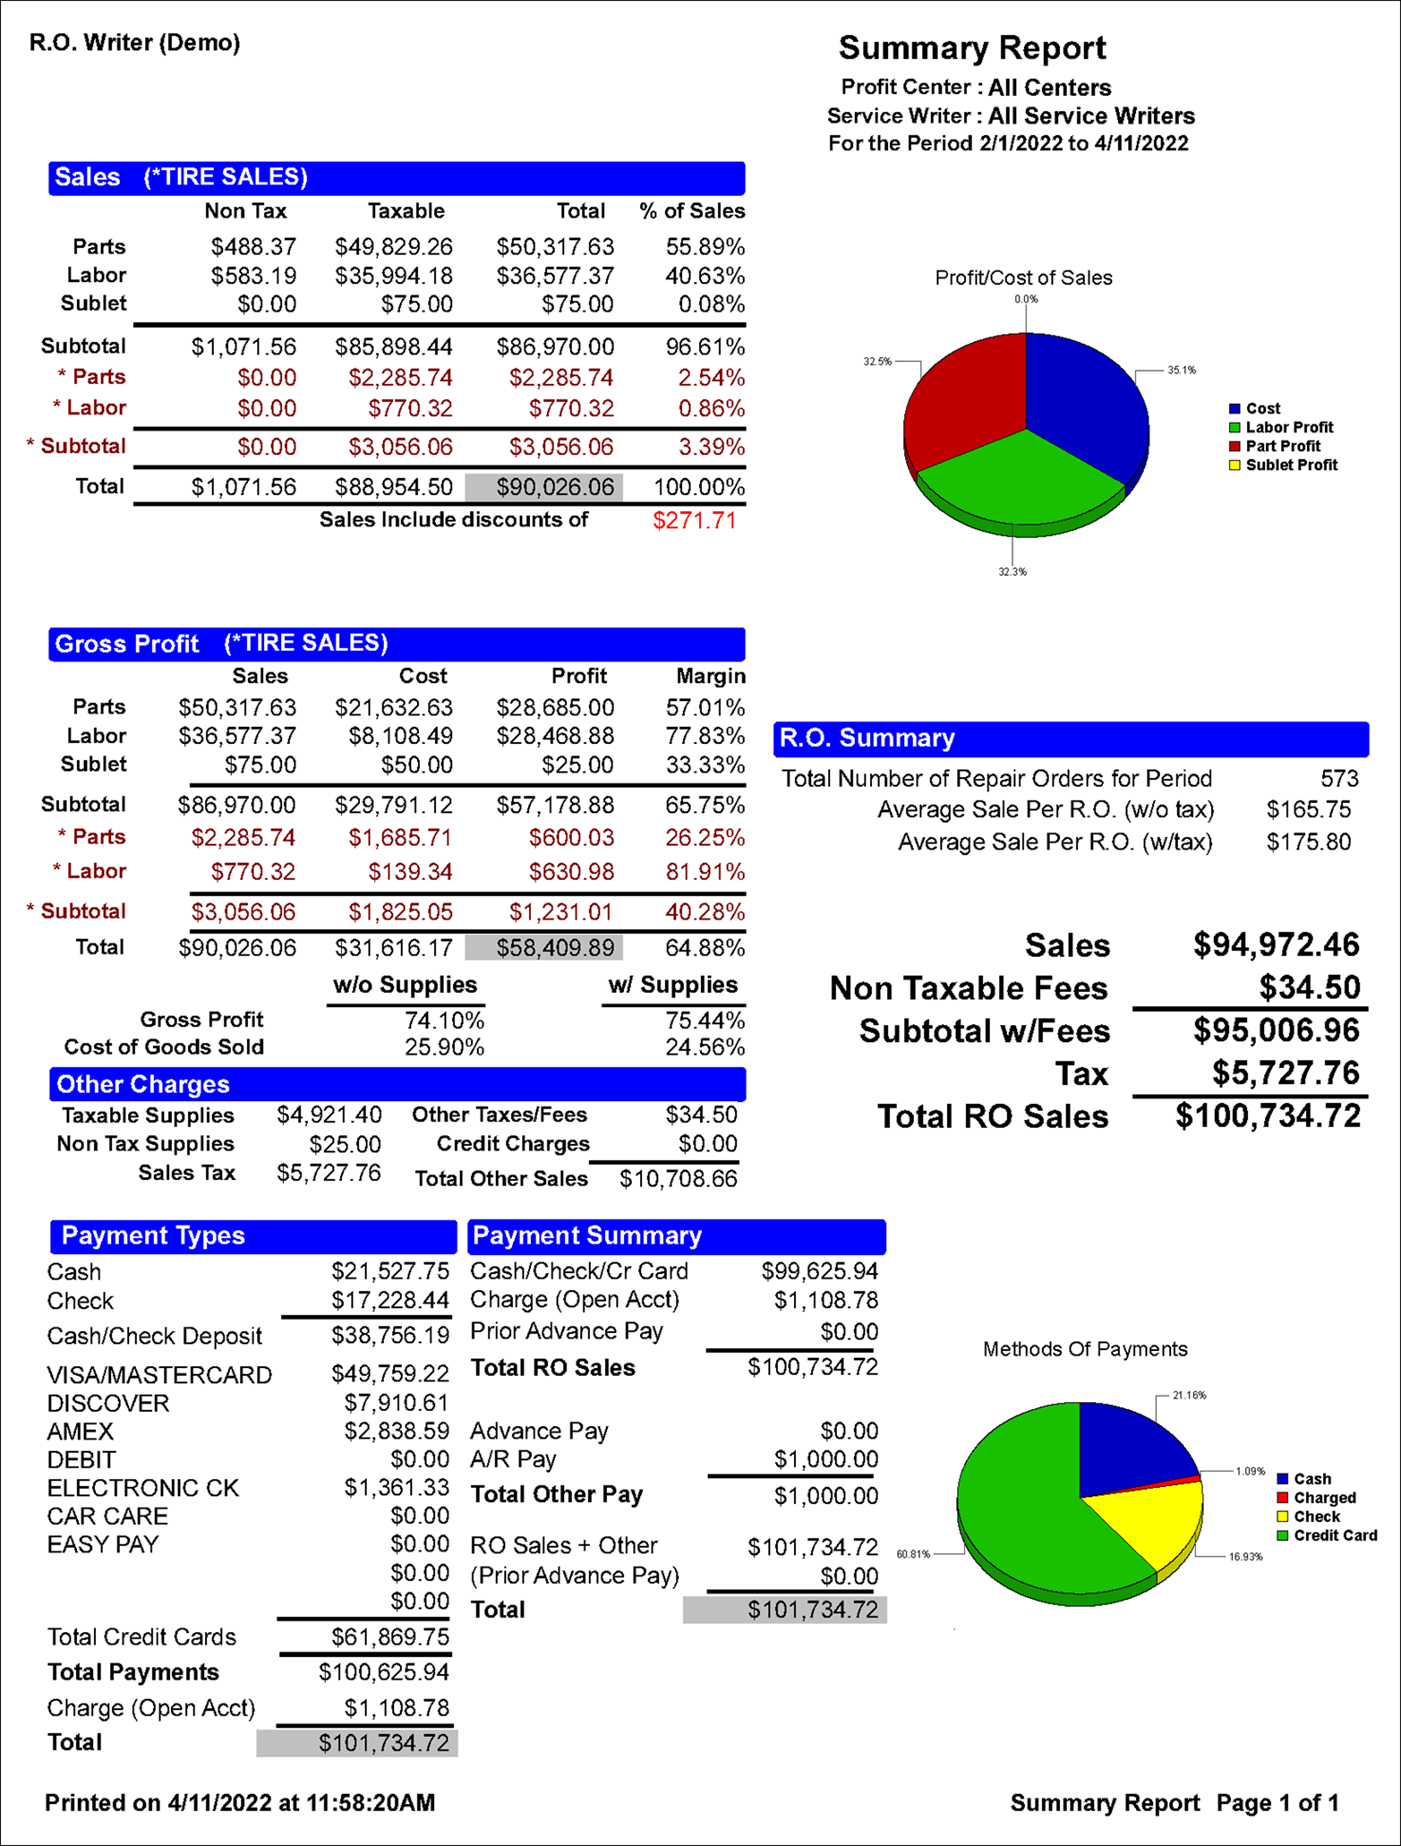
Summary Report
The Summary Report shows a summary of all sales for a date range you select when you run the report.
Breakout Sales Section
This breakout sales section breaks down the total receipts on sales from the labor operations and parts department groups selected for the report. You can enter the name of this section in Sales Report Options.
Each subsection includes subtotals and totals.
Categories in the Breakout Sales Section
| Category | Description |
|---|---|
| Parts, Labor, Sublet - Sales | The non-taxable totals for each category. |
| Parts, Labor, Sublet - Taxable | The taxable totals for each category. |
| Parts, Labor, Sublet - Total | The sum of non-taxable totals plus (+) taxable totals for each category. |
| Parts, Labor, Sublet - % of Sales | The percentage (%) of total sales for each category. |
There are three entries below the table in this column that show the discounts, package savings, and package adds included in the totals.
Gross Profit Section
The Gross Profit section breaks down the overall profit for the report. Each subsection includes subtotals and totals.
| Category | Description |
|---|---|
| Parts, Labor, Sublet - Sales | The total sales for each category. |
| Parts, Labor, Sublet - Cost | The total cost for each category. |
| Parts, Labor, Sublet - Profit | The total profit for each category. |
| Parts, Labor, Sublet - Margin | The profit margin for each category. |
NOTE: Parts Sales and Parts Cost include core charges and taxable fees.
Gross Profit and Cost of Goods Sold Subtotals
These subtotals do not include labor cost, freight, returns, or warranty refunds.
| Column | Description |
|---|---|
| % w/o Supplies |
The total percentage excluding supply charges. ( |
| % w/Supplies |
The total percentage including supply charges. ( |
Other Charges Section
| Charge | Description |
|---|---|
| Taxable Supplies | The total supply charges. |
| Non Tax Supplies | The total supply charges on repair orders where no sales tax was charged. For example, on a repair order for a customer who is set up as a non-taxable customer. |
| Sales Tax | The total sales tax charged to customers. |
| Other Taxes/Fees | The total non-taxable parts fees excluding core charges. |
| Credit Charges |
The total fees charged on credit card transactions. You can establish this fee by selecting the Upcharge for Credit Card option in Configuration. The fee is a percentage of the total repair order amount. |
| Total Other Sales |
The total sales for the Other Charges section. Taxable Supplies plus (+) Non Tax Supplies plus (+) Sales Taxes plus (+) Other Taxes/Fees plus (+) Credit Charges. |
Payment Types Section
The Payment Types section includes the cash, check, and credit card payments charges to Accounts Receivable.
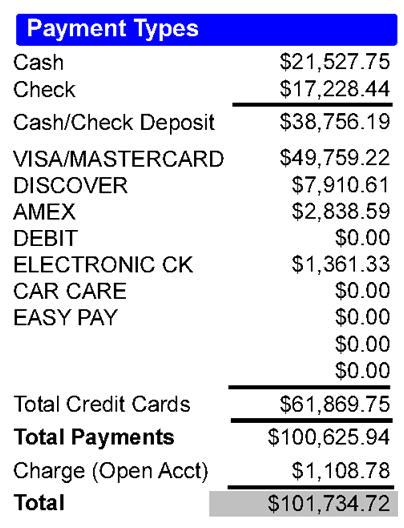
These values are represented in the Method of Payment pie chart on the right side of the report.
|
Amount |
Description |
|---|---|
| Cash | The total cash payments. |
| Check | The total check payments |
| Cash/Check Deposit | The subtotal of cash and check payments. |
| List of payment types | Each row is a payment type. The amount is the amount received for that payment type. |
| Total Credit Cards | The subtotal of all credit card payments in the list. |
|
Total Payments |
The subtotal of all cash, check, and credit card payments in the list. |
| Charge (Open Account) | The total charges to open Accounts Receivable accounts. |
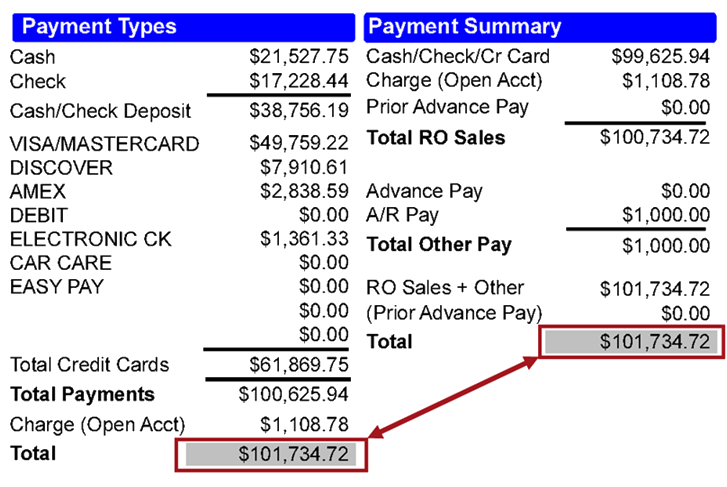
| Total |
The total for the Payment Types section, which is calculated as follows: Cash/Check Deposit plus (+) Total Credit Cards plus (+) Total Payments plus (+) Charge (Open Account). This total should match the total in the Payment Summary section. |
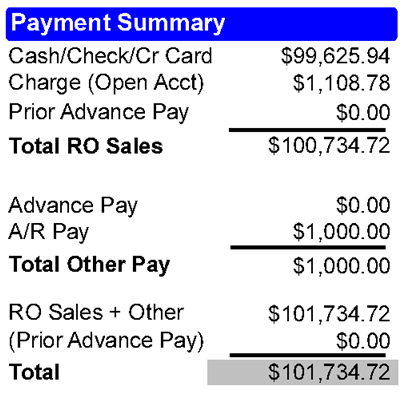
Payment Summary Section
The Payment Summary section includes total repair order sales, advanced payments, and Accounts Receivable charges.
|
Amount |
Description |
|---|---|
| Cash/Check/Cr Card | The total for cash, check, and credit card payments, which is calculated as follows: Cash/Check Deposit plus (+) Total Credit Cards excluding advanced and Accounts Receivable payments. |
| Charge (Open Account) | The total charges to open Accounts Receivable accounts. |
| Prior Advanced Pay | The total of advanced payments received on closed repair orders before the closing date. |
| Total RO Sales |
Total RO Sales is calculated as follows: Cash/Check/Cr Card plus (+) Charge (Open Account) plus (+) Prior Advanced Pay. The Total RO Sales amount here should match the Total RO Sales amount in the R.O. Summary section. |
| Advanced Pay | The total advanced payments received on repair orders of all statuses both open and closed. |
| A/R Pay | The total amount of Accounts Receivable payments. |
| Total Other Pay | The total of Advance Pay plus (+) A/R Pay. |
| RO Sales + Other | This is a subtotal calculated as Total RO Sales plus (+) Total Other Pay. |
| (Prior Advanced Pay) | The total of advanced payments received on closed repair orders before the closing date. This amount is subtracted. |
| Total |
The Total amount, which is calculated as follows: Total RO Sales plus (+) Total Other Pay minus (-) Prior Advanced Pay. This total should match the total in the Payment Types section. |
Totals in the Payment Sections
The totals in the payment sections should match.
R.O. Summary Section
The Total RO Sales in the R.O. Summary section should match the Total RO Sales in the Payment Summary section.
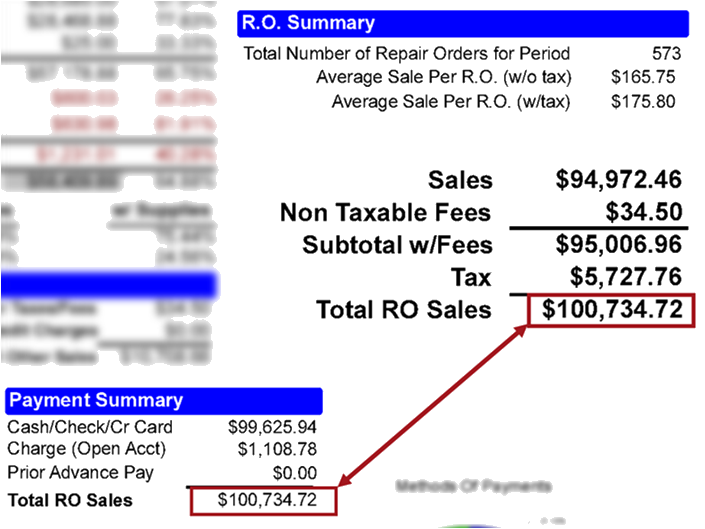
| Value | Description |
|---|---|
| Total Number of Repair Orders for Period | The total number of repair orders that closed within the date range. |
| Average Sale per R.O. (w/o tax) |
The average sale amount per repair order without the taxes charged. The calculation is the total sales divided by total number of repair orders. |
| Average Sale per R.O. (w/tax) |
The average sale amount per repair order with the taxes charged. The calculation is the total sales with tax divided by (∕) total number of repair orders. |
| Sales | The total amount for repair order sales, which is calculated as follows: parts, labor, and sublet sales plus (+) the taxed supplies plus (+) non-taxed supplies plus (+) the credit charges. |
| Non Taxable Fees | The total amount of other taxes and fees. |
| Subtotal w/Fees | The total amount of repair order sales with the non-taxable fees, which is calculated as follows: Sales plus (+) Non Taxable Fees. |
| Total Tax | The total sales tax on closed repair orders. |
| Total RO Sales |
The total repair order sales, which is calculated as follows: Sales plus (+) Non Taxable Fees plus (+) Tax. This total matches the Total RO Sales amount in the Payment Summary section. |
Pie Charts
Two pie charts visually display some of the totals on the report:
- The Profit/Cost of Sales pie chart shows the profit versus the cost.
- The Methods of Payment pie chart shows the payment types.