The Shop Performance Report provides a snapshot of sales and cash flow activity for your shop. There are two pages. The sections on each page include specific measurements of shop performance.
The beginning values on the Shop Performance Report are based on the snap data created when the End of Day report is run.
Report Sample
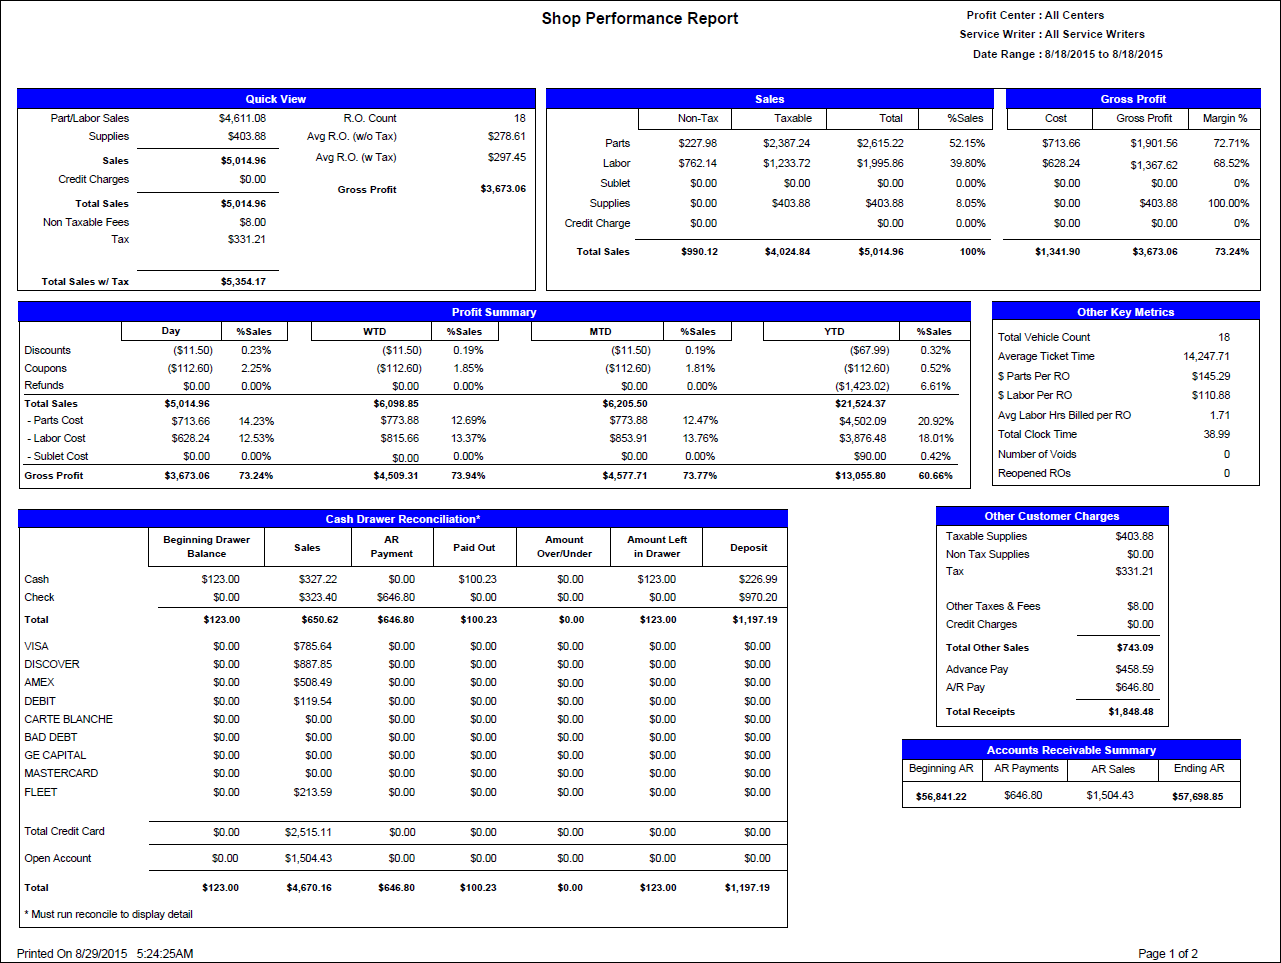
Quick View Section
| Row | Definition |
|---|---|
| Parts/Labor Sales |
Total parts, labor, and sublet. Sales include discounts, coupons, and package discounts. |
| Supplies | Total supply charges. |
| Credit Charges | Fees charged to customers for using a credit card. This is a percentage of the total repair order amount set up in Configuration (Configuration menu > Repair Order > Taxes and Fees > Upcharge for credit card). |
| Non Taxable Fees | Total non-taxable parts fees not including core charges. |
| Tax | Total sales taxes. |
| R.O. Count | Total number of repair orders finalized. |
| Avg R.O. (w/o Tax) | Average sales per repair order not including sales taxes. |
| Avg R.O. (w Tax) |
Average sales per repair order including sales taxes. |
| Total Sales w/ Tax | The total of all items. |
Sales and Gross Profit Section
This section displays total non-taxable sales, taxable sales, total sales, % of sales, cost, gross profit, and profit margin for parts, labor, sublet, supplies, and credit charges.
Profit Summary Section
This section displays totals and % of sales by day, week to date (Sunday to Saturday), month to date (first of the month to date), and year to date (January 1 to date) for discounts, coupons, refunds, parts cost, labor cost, sublet cost, and gross profit.
Other Key Metrics Section
| Row | Definition |
|---|---|
| Total Vehicle Count | Total number of vehicles. |
| Average Ticket Time | The arrival time on the Service Requests tab and the time the ticket is closed. |
| $ Parts Per RO | Average parts sales per repair order. |
| $ Labor Per RO | Average labor sales per repair order. |
| Avg Labor Hrs Billed per RO | Average number of hours billed per repair order. |
| Total Clock Time | Total hours employees were clocked in using the Employee Time Clock. |
| Number of Voids | Number of repair orders voided. |
| Reopened ROs | Number of repair orders reopened from history. |
Cash Drawer Reconciliation Section
The Reconcile process must be run in the Accounting Interface module before running the Shop Performance Report because it reconciles the cash drawer.
This section includes the:
- Total amount brought in that day in sales for each payment type and charge to Accounts Receivable.
- Total amount brought in that day via Accounts Receivable payments for each payment type.
- Total amount of cash paid out via Accounts Payable that day.
- Total amount the cash drawer was over or under.
- Total amount left in the cash drawer.
- Total amount of the bank deposit.
Other Customer Charges Section
| Row | Definition |
|---|---|
| Taxable Supplies | Amount of taxable supply charges. |
| Non Tax Supplies | Amount of non-taxable supply charges (Non-taxable supplies are supplies calculated on repair orders that charged no sales taxes such as in the case the customer was tax-exempt). |
| Tax | Amount of sales taxes. |
| Other Taxes & Fees | Non-taxable parts fees not including core charges. |
| Credit Charges | Fees charged to customers for using a credit card. This is a percentage of the total repair order amount set up in Configuration (Configuration menu > Repair Order > Taxes and Fees > Upcharge for credit card). |
| Total Other Sales | Taxable Supplies + Non-Taxable Supplies + Other Taxes and Fees + Credit Charges |
| Advance Pay | Total amount of advance payments. |
| A/R Pay | Total amount of payments posted in Accounts Receivable. |
| Total Receipts | Total Advance Payments + Total Accounts Receivable Payments |
Accounts Receivable Summary Section
This section displays total amounts in Accounts Receivable.
| Column | Definition |
|---|---|
| Beginning AR | Total beginning amount owed. |
| AR Payments | Total amount of payments posted. |
| AR Sales | Total amount charge to customers. |
| Ending AR | Total ending amount owed to your shop. |
Page Two of the Shop Performance Report
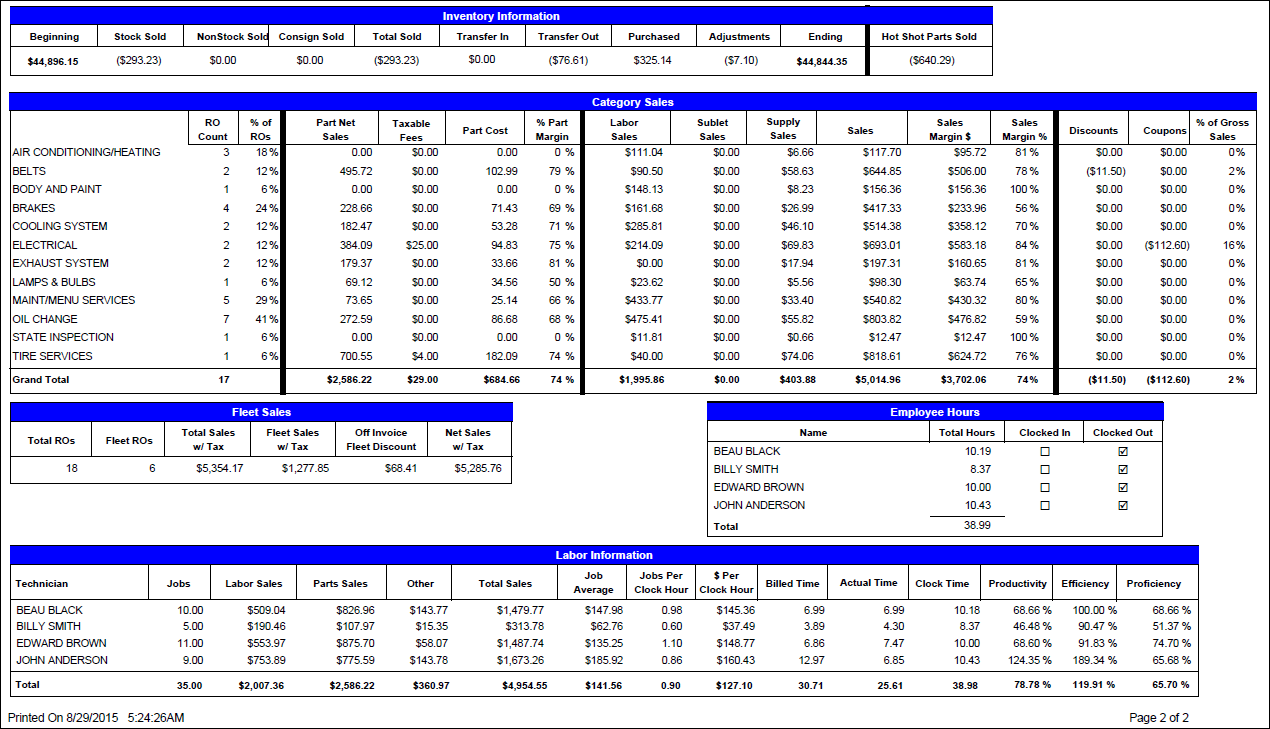
Inventory Information Section
| Column | Definition |
|---|---|
| Beginning Inventory Value | The beginning inventory value. |
| Stock Sold | Total stock parts sold. |
| Non-Stock Sold | Total non-stock parts sold. |
| Consign Sold | Total Consigned parts sold. |
| Total Sold | Total of all parts sold. |
| Transfer In | Total cost of parts transferred in from another store. |
| Transfer Out | Total cost of parts transferred to another store. |
| Purchased | Total cost of parts received into Inventory using Post Receipts or PO Management. |
| Adjustment | Total cost of parts adjusted in inventory using Adjustments in Inventory. |
| Ending Inventory Value | The ending inventory value. |
| Hot Shot Parts Sold | Total cost of non-stock parts sold. |
Category Sales Section
This section displays sales and profit margin information by labor category. For each labor category, the following information is provided:
|
Column |
Definition |
|---|---|
|
RO Count |
Total number of repair orders that included that category. |
|
% of ROs |
Percentage of repair orders closed that day that included that category. |
|
Part Net Sales |
Total part sales included in that category. |
|
Taxable Fees |
Total taxable parts fees included in that category. |
|
Parts Cost |
Total cost of parts included in that category. |
|
% Part Margin |
Percentage of total parts sales included in that category. |
|
Labor Sales |
Total labor sales included in that category. |
|
Sublet Sales |
Total sublet sales included in that category. |
|
Supply Sales |
Total supply charges calculated for that category. |
|
Sales |
Total sales included in that category. |
|
% of Gross Sales |
Percent of Gross Sales that were discounts and coupons. |
Fleet Sales Section
This section shows your fleet sales.
| Column | Definition |
|---|---|
|
Total ROs |
Total number of repair orders closed. |
|
Fleet ROs |
Total number of fleet repair orders closed. |
|
Total Sales w/Tax |
Total sales including sales taxes not including fleet sales. |
|
Fleet Sales w/Tax |
Total fleet sales including sales taxes. |
|
Total amount of off-invoice fleet discounts. |
|
|
Net Sales w/Tax |
Total Sales both regular sales and fleet sales. |
Employee Hours Section
This section displays the data from the Employee Time Clock within the selected date range. Each row is an employee.
- All employees that clocked in and out.
- The Total Hours each employee was clocked in. The Total Hours should match the Clock Time in the Labor Information section.
- If the employee was clocked in or clocked out at the time the report was run.
Labor Information Section
This section displays detailed information about Technicians. Each row is a technician.
| Column | Definition |
|---|---|
| Technician | Technician's name |
| Jobs | Total number of jobs performed by the technician |
| Labor Sales | Amount of labor sales |
| Parts Sales | Amount of part sales |
| Other | Non-taxable supplies, sublet, and supply charges |
Totals for Labor Information Section
| Column | Definition |
|---|---|
| Job Average | Average amount per job. |
| Jobs Per Clock Hour | Number of jobs performed per hour clocked in. |
| $ Per Clock Hour | Amount of Sales generated per hour clocked in. |
| Billed Time | Amount billed to customers on labor jobs. |
| Actual Time | The Elapsed Time calculated by the Labor Time Clock. |
| Clock Time | Total hours that each employee was clocked in according to the Employee Time Clock. The Clock Time should match the Total Hours in the Employee Hours section. |
| Productivity | The percentage of how many hours the technician was available; measured by the amount of time clocked in during the date range specified using the Employee Time Clock compared to the hours billed. |
| Efficiency | The percentage of hours billed compared to actual time. |
| Proficiency |
The percentage of hours the technician spent working on repairs (based on the Elapsed Time recorded by the Labor Time Clock) compared to the number of hours he or she was clocked in (using the Employee Time Clock). The calculation is Actual Time / Clock Time *100. |